Reports | Dock Efficiency
- alannablackwell
- Dec 9, 2025
- 3 min read

Below are explanations of different metrics in the Dock Efficiency section:

Total Trucks Serviced
Count the # of trailer sessions that were recorded for that dock(s). A session may have a truck/trailer number recorded to the session or may not have a truck/trailer number recorded to a session, but we should still count a session as servicing a truck. Sessions are counted only on the start date.
AVG Dock Session Length
For each trailer session difference between the start of trailer session and the end of trailer session is calculated, then sum of each value is divided by the number of trailer session in the selected period.
Busiest Time
Find the time when the maximum number of docks was busy for the selected period of time.
Count the # of busy docks (docks that have at least 1 trailer session per Weekday & Hour) with the time period, and the time period with the most number of of busy docks is the busiest time.
If for example a trailer session was from 9 am to 11 am. We should count all 1-hour blocks of time as busy time for that dock.
Door Efficiency
If there is no Door sensor for the docks ... blank this out in a nice way. – No Data available
To make this simple:
Door efficiency will be % of time Door open with an active trailer session
Door inefficiency will be % of time Door open without an active trailer session
Truck Sessions Over the Period

Truck Sessions Per Day (Close to Detention + In Detention + Efficient)
The bar chart per day is a sum of all the Sessions that happened in all Docks and the definition is/are:
Efficient sessions = sessions that did not exceed the Dock Time Limit Settings or there are no constraints connected to the session length
Close to Detention = sessions which were efficient (meaning they did not exceed the Dock Time Limit settings) but went past the prescribed Time Limit warnings
In Detention = any session that went beyond the Dock Time Limit setting
It is expected that the sum of the Efficient + Close to Detention + Inefficient Sessions = all Sessions for that day.
The Average sessions in the Truck Sessions per Day is Total sessions recorded for that time period / number of days.
AVG Trucks per Day
The number of trucks serviced is calculated for each day, then sum of these values is divided by the number of days in the selected period.
Truck Sessions Per Dock

Truck Sessions Per Dock (Close to Detention + In Detention + Efficient)
The bar chart per dock is a sum of all the Sessions that happened in the Dock, and the definition is/are:
Efficient sessions = sessions that did not exceed the Dock Time Limit Settings or there are no constraints connected to the session length
Close to Detention = sessions which were efficient (meaning they did not exceed the Dock Time Limit settings) but went past the prescribed Time Limit warnings
In Detention = any session that went beyond the Dock Time Limit setting
The sum of the Efficient + Close to Detention + Inefficient Sessions = all Sessions for that Dock.
The average sessions in the Truck Sessions per Dock is Total sessions recorded for that time period / total Docks.
AVG Truck Sessions per Dock
The number of trucks serviced is calculated for each dock, then sum of these values is divided by the number of docks.
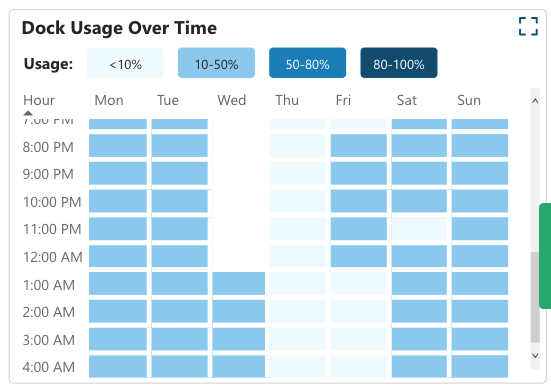
Dock Usage Over Time
Count the AVERAGE # of busy docks (docks that have at least 1 trailer session per Weekday & Hour) with the time period, find the share of busy docks of total number of docks in facility for the current day.
If for example a session was from 9 am to 11 am...we should count all 1-hour blocks of time as busy time for that session.